26 August 2026 · Rasuwa and Nuwakot, Nepal
Trace the Langtang–Trishuli flood, minute by minute.
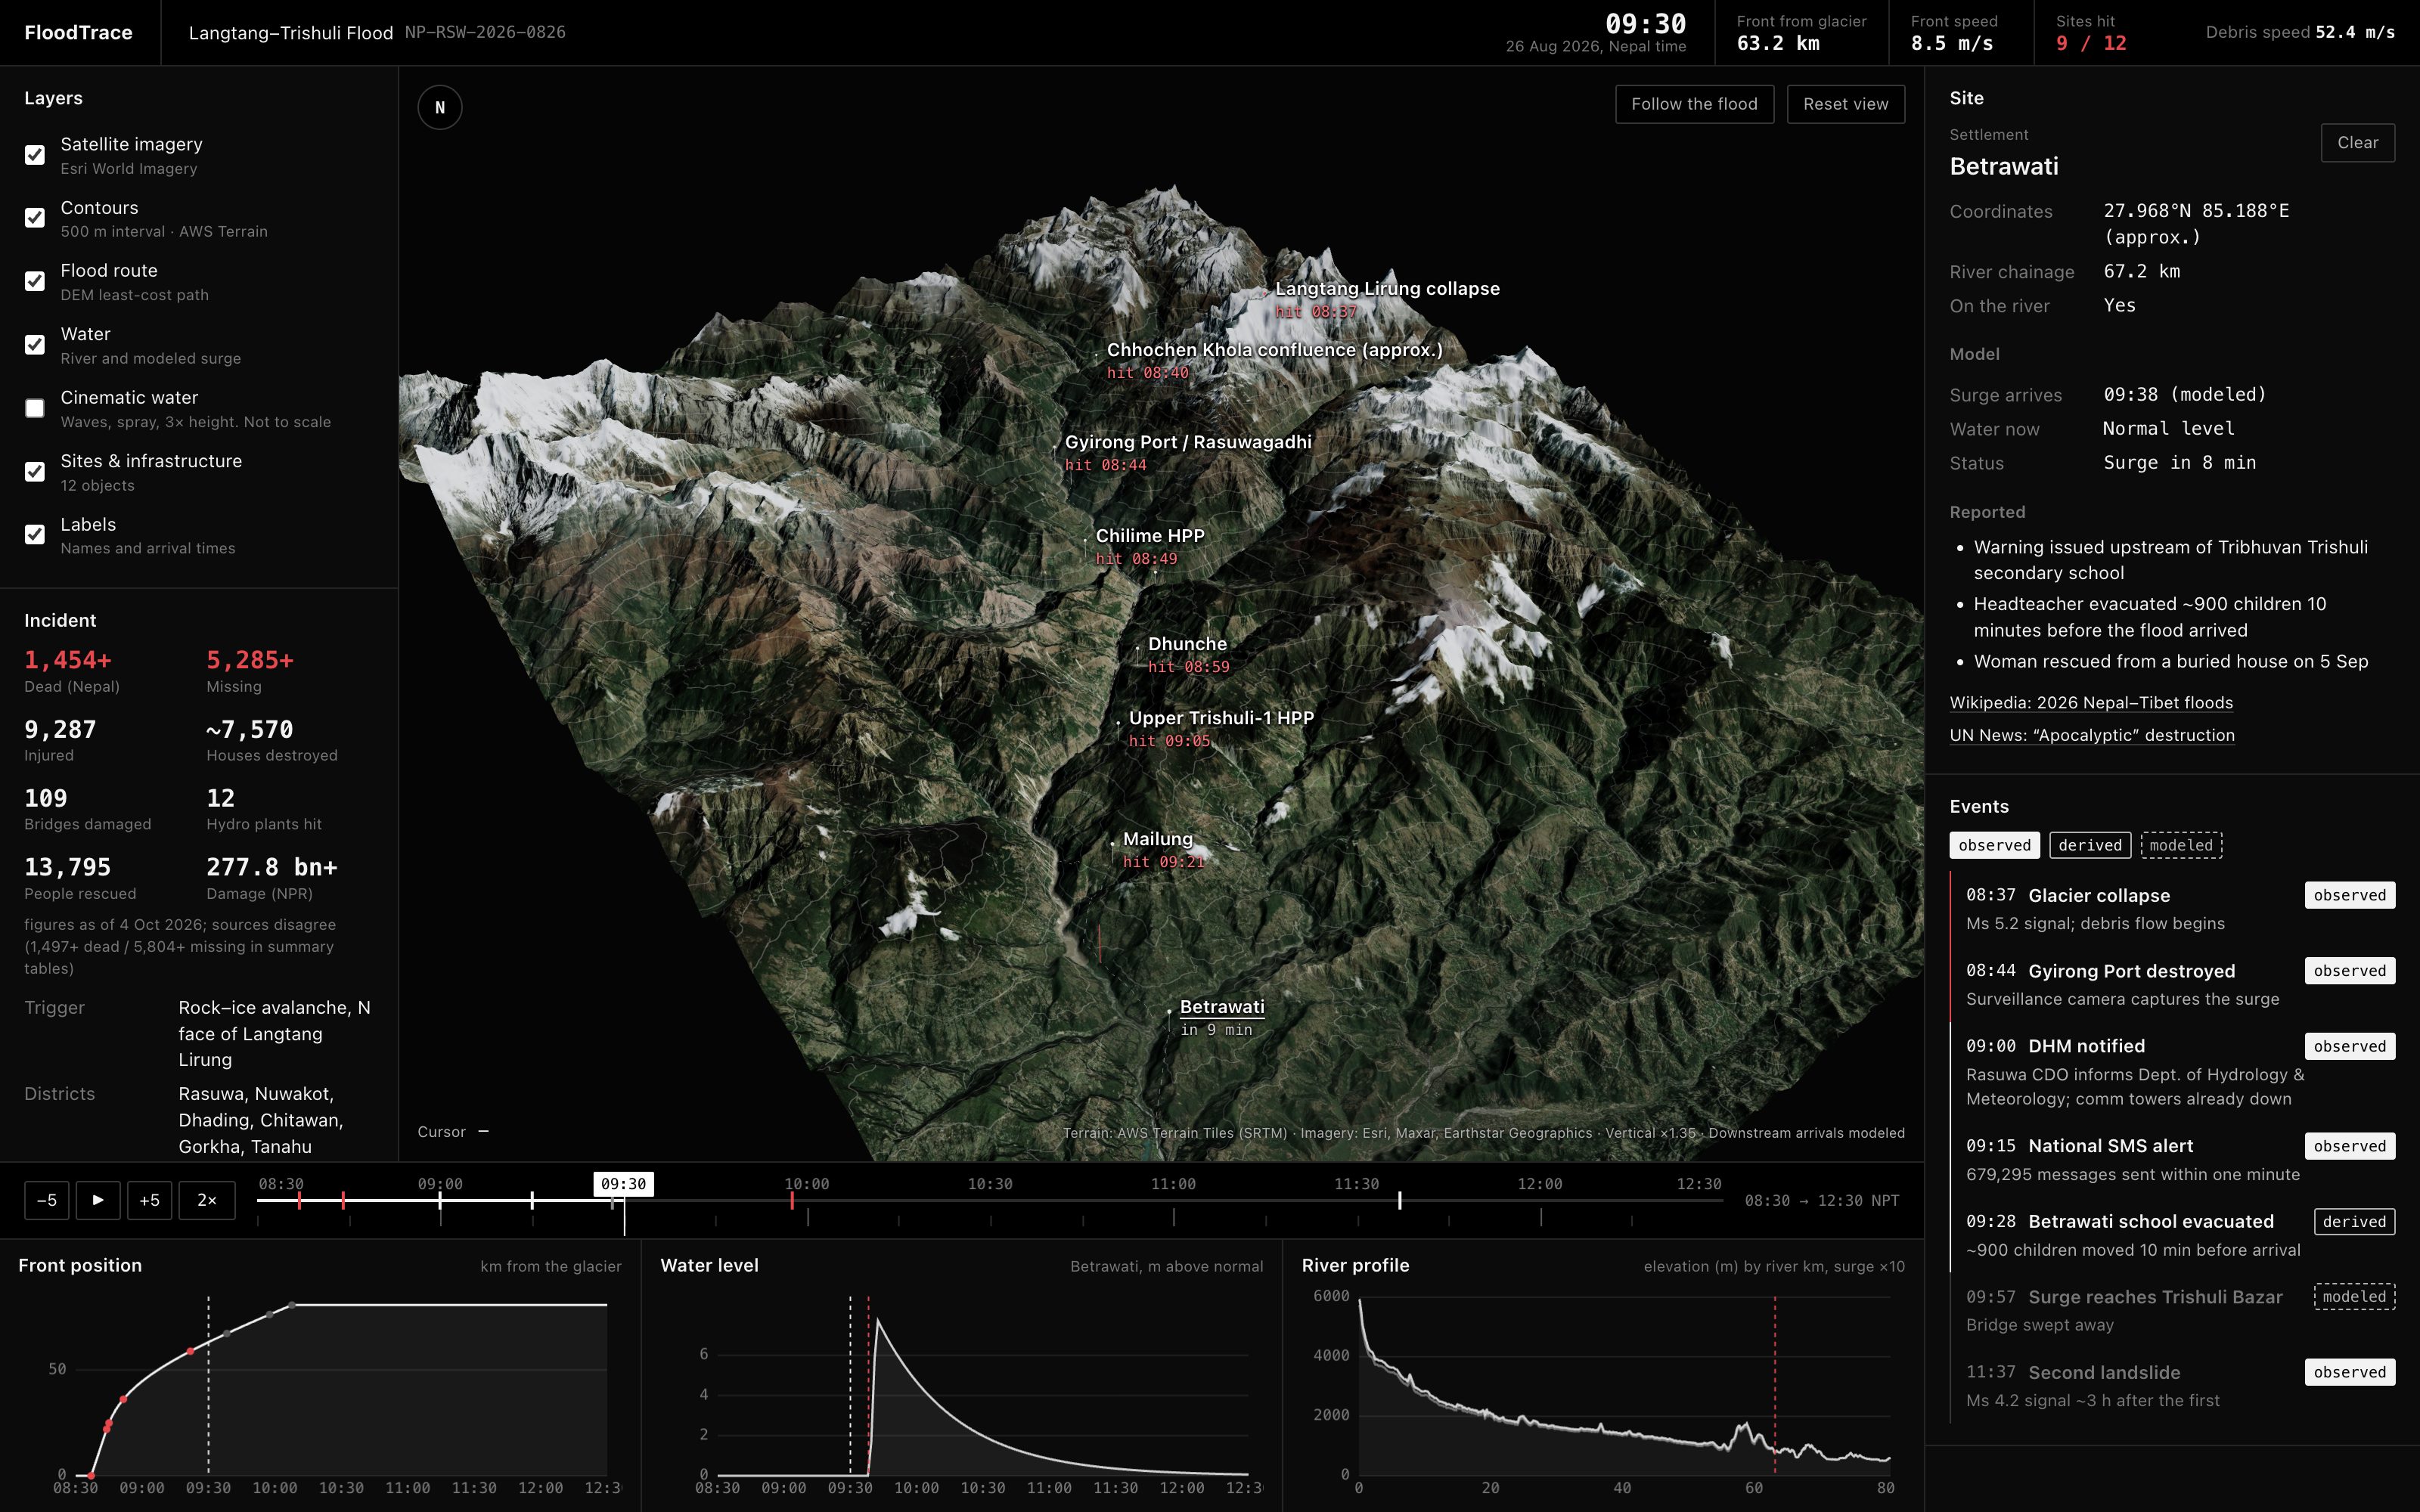
At 08:37 a block of rock and ice fell from Langtang Lirung. Seven minutes later the surge destroyed the Gyirong border crossing, and by mid-morning it had run 80 km down the Trishuli. FloodTrace rebuilds that morning on real terrain so you can watch where the water went and when.
How it works
-
Real ground
Twelve elevation tiles from the AWS Terrain dataset and 192 Esri satellite tiles cover a 52 × 69 km box from the glacier to Bidur. They load straight into the browser and become a 786,000-vertex terrain mesh.
-
A route water would take
Dijkstra's algorithm runs over the elevation grid with a cost that rises steeply with height, so the path hugs valley floors. Chained through the known settlements, it gives an 80.7 km river measured in kilometres.
-
One observation, two phases
The only timed point is the Gyirong camera: 22 km in 7 minutes, about 52 m/s, close to the published debris estimate. Below Gyirong the front slows toward a 7 m/s flood wave, an assumption based on the 2021 Chamoli flood.
-
Water that fills the valley
Cross-sections every 60 m carry a water sheet at river bed plus surge height. The terrain hides it wherever the ground is higher, so the flood edge follows the real valley walls, and silt stays on the slopes after it passes.
Follow the flood
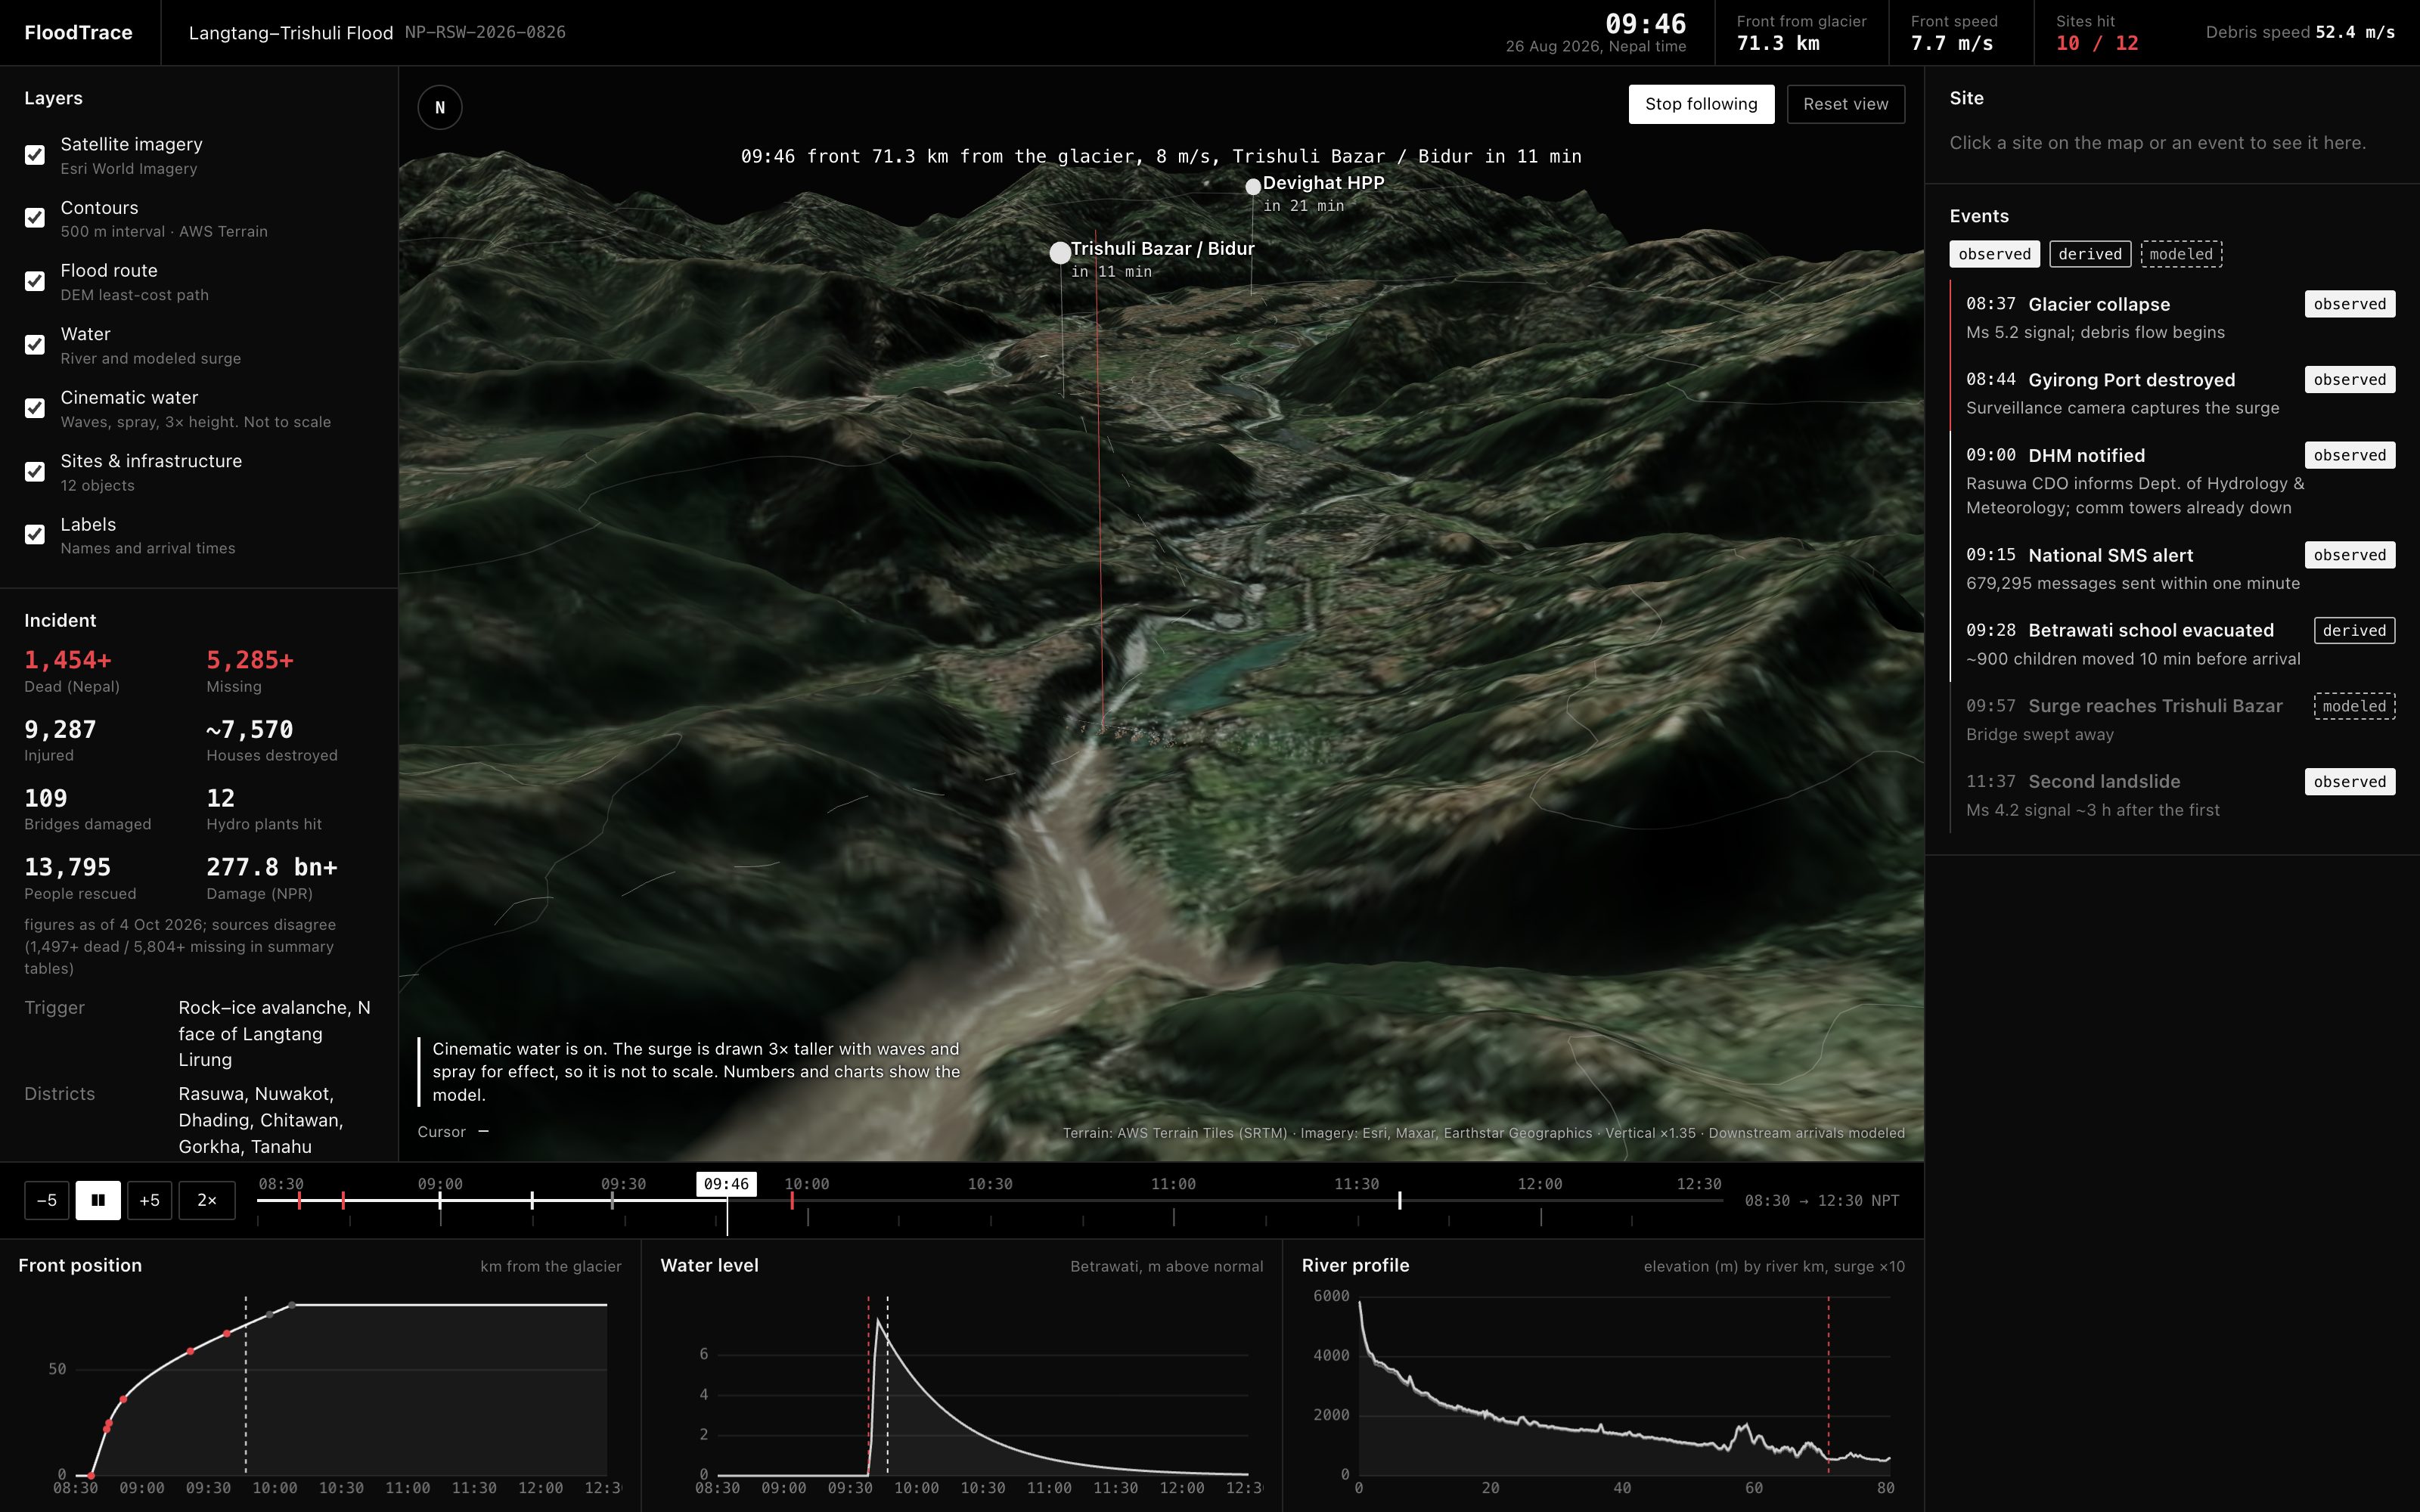
One button replays the morning with the camera chasing the front down the valley. Playback slows for the 52 m/s debris flow and speeds up for the slower flood wave, so the surge crosses the screen at a steady pace. The camera rises over any ridge that would block the view.
Cinematic water adds rolling waves, spray and a breaking front for presentations. It draws the surge three times taller and says so on screen. The numbers never change.
What is real and what is modeled
Every time in the dashboard carries one of three labels. The difference matters more than the animation.
Reported by people or instruments: the 08:37 seismic signal, the 08:44 camera footage at Gyirong, the 09:15 national SMS alert, casualty and damage figures.
Calculated from observations: the 52.4 m/s debris speed, and the Betrawati school evacuation placed 10 minutes before the modeled arrival because the headteacher reported that gap.
Produced by the model: arrival times below Gyirong, surge heights and flood width. Site positions are approximate to 1–2 km, and the route is computed, not surveyed.
Where next
- Real arrival times. Gauge records, CCTV timestamps and witness reports downstream of Gyirong would replace the assumed flood-wave speed with measurements.
- A real hydraulic model. A 2D shallow-water solver over a finer DEM would produce inundation from physics instead of a fitted curve.
- Post-event imagery. Sentinel-2 or Planet scenes from late August would show the actual silt line to check the model against.
- More incidents. The pipeline only needs a DEM box, a list of sites and one observed travel time, so Chamoli 2021 or Melamchi 2021 could follow.
More than 1,450 people died in this flood and over 5,000 are still missing. FloodTrace is a way to understand what happened that morning. It is not a forecast and should not be used for warning or rescue decisions.